Characteristics of Gravity Waves
The ERA5 reanalysis, with hourly time steps and ~30 km horizontal resolution, resolves a substantially larger fraction of the gravity wave spectrum than its predecessors. Gravity waves transport momentum and energy in the atmosphere, exerting a profound influence on global circulation. Here, we use the ERA5 reanalysis to examine the properties of gravity waves. Two-sided zonal wavenumber-frequency power spectra of a suite of atmospheric fields (shown below) exhibit clear gravity wave signatures extending along the broad swaths with phase speeds on the order of ±35 m/s. There is evidence of two prevalent gravity wave modes: a faster one with a phase speed of ±49 m/s, and a slower one with a phase speed of ±23 m/s, shown by straight black lines in the figures, which correspond to the first and second baroclinic modes.
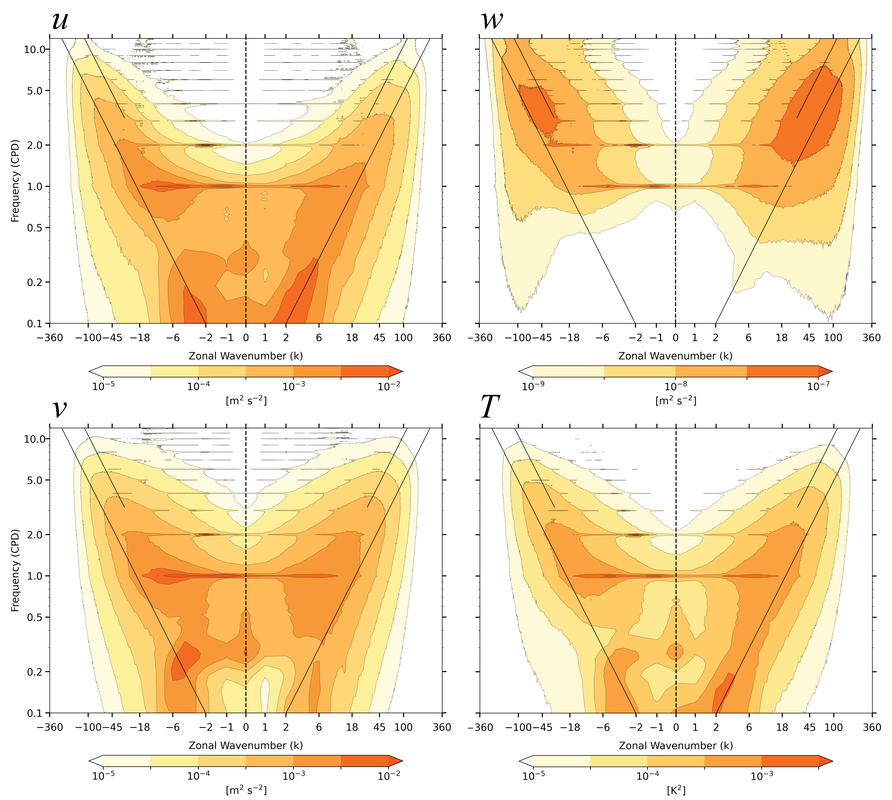
Two-sided zonal wavenumber-frequency spectrum of the indicated variables at the 50 hPa level over the tropics. The sloping straight black lines correspond to phase
speeds of ±49 m/s (upper) and ±23 m/s (lower).
|
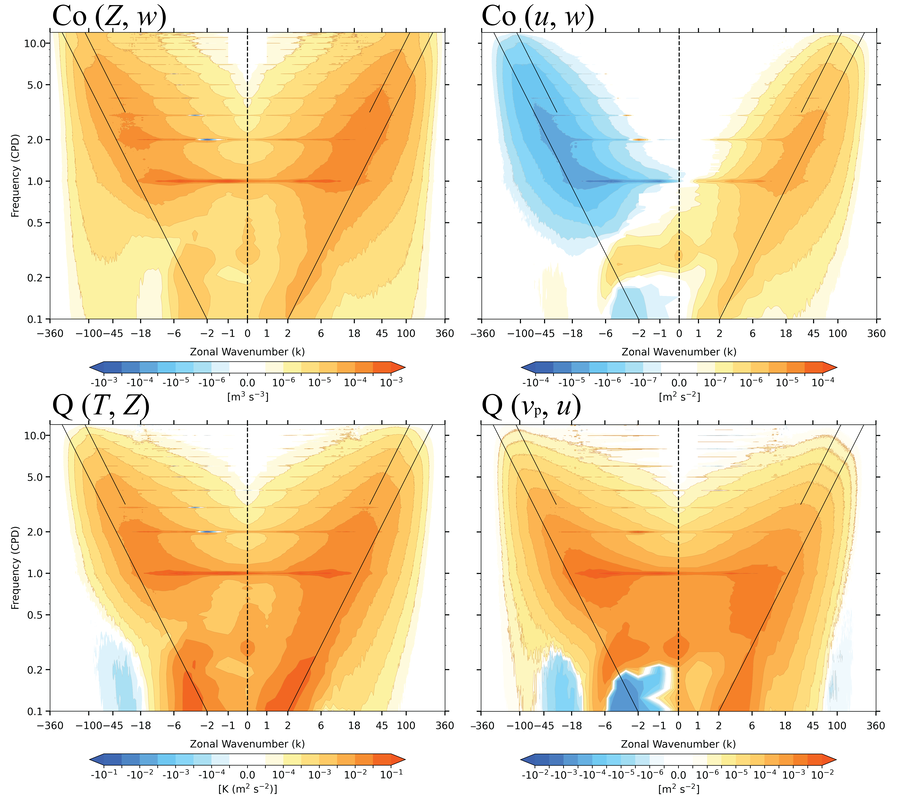
Two-sided zonal wavenumber-frequency cospectrum (Co) and the quadrature spectrum (Q) between indicated variables at the 50 hPa level over the tropics. The sloping straight black lines correspond to phase speeds of ±49 m/s (upper) and ±23 m/s (lower).
|
Stratospheric Circulation and Dynamics
Advances in weather and climate research have demonstrated the significant role of the stratosphere in the Earth system across a wide range of temporal and spatial scales. That is why part of my PhD work focuses on studying the stratospheric dynamics and processes, including the quasi‐biennial oscillation (QBO), which is the primary mode of interannual variability in the tropical and subtropical stratosphere. As shown by the following animation, the QBO is characterized by the downward propagation of successive westerly and easterly wind regimes (contours) with an average period of about 28 months. Also shown is the QBO-related temperature field (colored shading). We investigated the momentum budget and wave forcing of the QBO using ERA5 reanalysis. Because of ERA5’s higher spatial resolution compared to its predecessors, it is capable of resolving a broader spectrum of atmospheric waves and allows for a better representation of the wave-mean flow interactions, both of which are of crucial importance for QBO studies.

The animation is constructed by regressing the zonal wind and temperature fields upon the pairwise rotated principal components of the QBO, and shows one complete cycle of the QBO. Based on a 40-year record (1979-2018) of ERA5 reanalysis data.
The Effect of Hydrometeors on Satellite Temperature Observations
The temperature of Earth’s atmosphere has been monitored continuously since late 1978 by the Microwave Sounding Unit (MSU) and the Advanced Microwave Sounding Unit (AMSU) flown on polar-orbiting weather satellites. It is well known that these measurements are affected by the scattering and emission from hydrometeors, including cloud water, precipitation, and ice particles. In this project, we investigated the hydrometeor effects on MSU/AMSU temperature observations by comparing satellite-observed temperature of the middle troposphere (TMT) with synthetic TMT constructed using temperature fields from ECMWF Interim [ERA-Interim (ERA-I)].
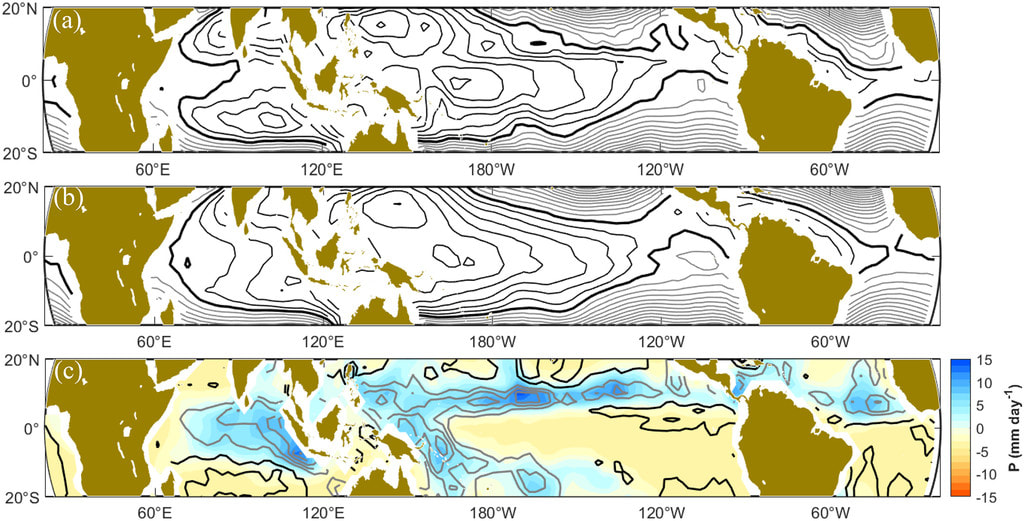
One month (November 2016) as an example of the effect of precipitation on MSU/AMSU temperature observations. (a) Observed TMT*, (b) Synthetic TMT*, and (c) Observed TMT* minus synthetic TMT*, superimposed by GPCP precipitation (colored shading); TMT* is the departure from the tropical 20°N–20°S mean. The contour interval in (a) and (b) is 0.2 K, and the zero contour is marked (heavy black line). The contour interval in (c) is 0.1 K, and negative contours are marked (gray).
Statistical Downscaling
Coarse spatial resolution of general circulation models (GCMs) is one of the major problems in using their outputs to assess the impacts of climate change. To extract regional-scale meteorological variables from GCM outputs, downscaling methods have been widely implemented in climate change studies. In this project, we developed a statistical model for downscaling of monthly precipitation using multiple linear regression (MLR). MLR methods usually estimate mean of local meteorological predictands accurately but significantly underestimate the variance and extreme values. To improve the performance of the model, we incorporated some novel statistical modifications: 1) A bias correction technique for increasing the accuracy of estimated variance, 2) A filter-based method for feature selection to attain the best subset of input predictors, and 3) A k-fold cross-validation, which allows to use all available data to train and calibrate the model. The effectiveness of the model is illustrated through its application to 288 rain gauge stations scattered in different climatic zones of Iran.

Modified De Martonne climate map and the distribution of selected rain gauge stations.
